
TerraX surveyed 247 sq km of the Lothal heritage region with drone LiDAR, merged every flight block into one seamless terrain model, and gave the master plan team measured ground levels at 0.04 m accuracy.
| Location | Lothal region, Dholka taluka, Ahmedabad district, Gujarat |
|---|---|
| Client type | State development authority, through its planning consultant |
| Purpose | Base survey for an infrastructure master plan: drainage, flood protection, roads and water bodies |
| Area | 247 sq km (about 61,000 acres), including eight villages and the Bhogavo river corridor |
| Survey | Drone LiDAR with RGB camera, flown in blocks of about 20 sq km |
| Ground control | At least 5 DGPS control points per block, independent checkpoints across the area, tied to a Survey of India benchmark |
| Height accuracy | 0.04 m RMSE against independent checkpoints |
| Outputs | Orthophoto (3 cm), DSM and DTM (0.25 m), contours at 0.5 m, 1 m and 2 m, classified point cloud |
The Lothal region is flat and low, about 2 to 15 m above sea level, and the Bhogavo river runs through it to the Gulf of Khambhat. Every drain, flood bund and holding pond in the master plan depends on level differences of a few centimetres. Old toposheets and 30 m satellite elevation data cannot show these, and a ground survey of 247 sq km would take many months.
The work also had to be delivered as one dataset. A master plan cannot work with separate blocks that do not match at their edges.
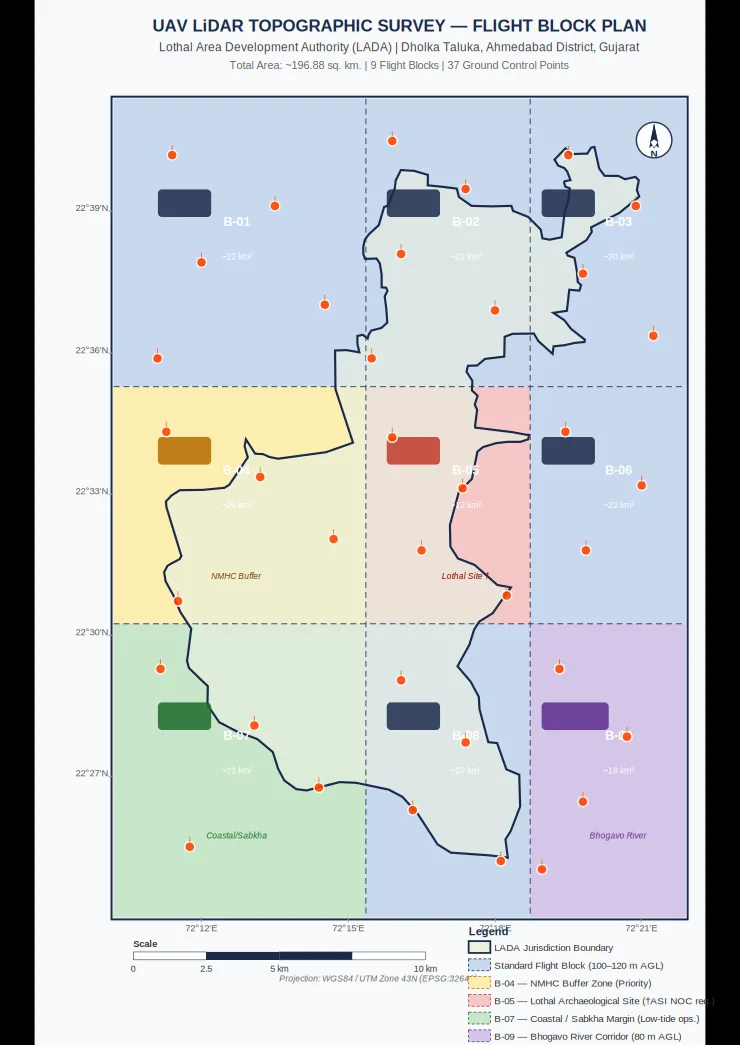
The area was divided into flight blocks of about 20 sq km, with block edges along roads, drains and canal banks so that joins fall on clear features. Each block was flown and checked on its own, so weather or access problems in one block never held up the rest.
Every block had at least five DGPS control points, four at the corners and one in the centre, measured from a base station on a Survey of India benchmark. Separate checkpoints were never used in processing; they were kept to test the final result. Canal banks were flown at lower height for extra detail.
Each block was processed, ground-classified and checked for strip-to-strip level agreement. The blocks were then merged into a single dataset and the overlaps between neighbouring blocks were checked so that levels match across every join.
The result is one continuous terrain model of the whole region, delivered in tiles so that billions of LiDAR points and 247 sq km of 0.25 m elevation data can be opened and used in GIS and CAD software.
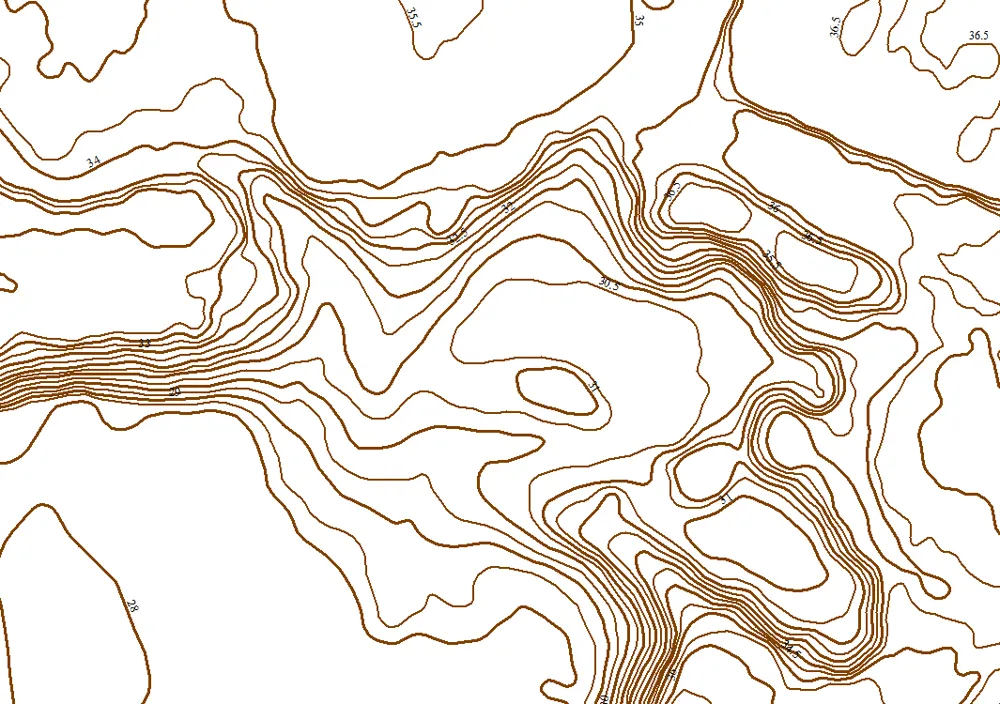
A true orthophoto at 3 cm, a DSM and DTM at 0.25 m, contour maps at 0.5 m, 1 m and 2 m intervals in SHP, DWG and PDF, and the classified point cloud. All data is in WGS 84 / UTM Zone 43N with EGM2008 heights.
The authority and its planning team were satisfied with the quality and the delivery. The terrain model became the base map for the master plan, used for flood hydrology, 2D flood modelling and the layout of drainage channels, flood protection bunds, water holding areas and roads.
Why it matters: one accurate, seamless terrain model let every planning discipline work from the same ground levels across 247 sq km.
Images from the TerraX survey report for this project. Click an image to open it full size.
Yes. The area is split into blocks of about 20 sq km, each flown and checked on its own, and then merged into one seamless dataset.
Each block has its own DGPS control, neighbouring blocks overlap, and the levels in every overlap are checked before the blocks are merged.
LiDAR measures ground levels under trees and crops, and keeps the sharp edges of drains and banks that flood models need.
Send the site location (KMZ or Google Maps pin), approximate area and what you need the survey for. We reply with a method, a price and a timeline.